
When businesses are equipped with insights from organizational data, day-to-day business decisions are greatly improved. Data can be appropriately applied once it has been processed, analyzed, and visualized efficiently, and that’s where Microsoft’s Power BI takes center stage. But, the journey from robust data analytics tools to relevant business insights can be a bit of a stretch without Power BI training.
Power BI training provides the knowledge and understanding of arranging and organizing data to produce the most relevant and updated data analysis and visualization. On the other hand, there is Microsoft Excel that allows quick data computation and analysis. Choosing between Excel and Power BI is a close call since they feel kind of similar. So, here is a comprehensive guide clarifying how Power BI is different from Excel.
Importance of Business Intelligence Tools
Data must be analyzed rapidly, and in real-time, to realize its full potential. Business intelligence (BI) brings together data mining, business analytics, data visualization, data infrastructure and tools, and the best practices to help businesses and organizations adopt a more data-driven approach to decision making. The following are some ways in which BI tools and platforms streamline the process of data analysis:
- BI platforms and tools are available for data visualization, ad hoc reporting, and creating personalized dashboards for customer-specific uses.
- BI tools help analysts quickly identify market trends to boost revenue or sales and increase profit.
- With BI tools, analysts can provide competitor and performance benchmarks to make the business run effortlessly and efficiently.
- BI tools help analyze customer behavior, allowing the organization to have a competitive edge and plan for future endeavors.
- Also, BI allows operation optimization, success prediction, and discovering real-time problems and issues.
What is Power BI?
Microsoft’s Power BI is a platform for business intelligence that provides tools for data analysis, aggregation, sharing, and visualization. Moreover, Power BI is very versatile with the ability to integrate with other products of Microsoft.
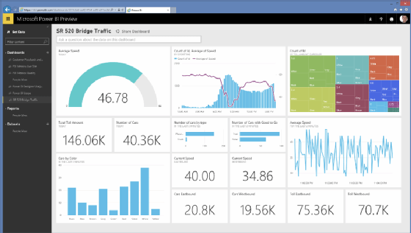
Power BI is used to derive insights from an organization’s data. It helps to connect discrete sets of data, clean and transform data into a data model, create data visualizations in the form of graphs or charts, and share these with intra-organization Power BI users. Also, Power BI provides executive dashboards for managers or administrators, giving more insight into how departments function. The data models and reports from Power BI can answer real-time business queries and help in forecasting to ensure that each department of the organization meets business metrics. Besides the wide variety of data sources that can connect to Power BI, some core components like Power Query, Power Pivot, Power Map, Power View, and Power Q&A facilitate creating and sharing data reports.
What is Microsoft Excel?
Thanks to progressive technology, we no longer need to carry out data analytics manually. Many tools and programs are available that can do the complete task of data analysis within seconds. One such tool is Microsoft Excel.

A part of Office 365 Suite, Excel is a spreadsheet program used for the recording and analysis of numerical data. The Excel spreadsheet is a collection of columns and rows, with alphabetical letters assigned to the columns and numbers assigned to rows. A cell is a point where a row and column meet, and its address is given by the letter signifying the column and the number representing the row.
Microsoft Excel is a standard spreadsheet, where you can arrange, format, and perform calculations on data by using formulas, and make visual representations of them. Excel is a remarkable tool if you want your computation and analysis to be quick. It offers more than 400 functions classified into 11 themes to ease and simplify your computation tasks. Unlike other Power BI tools, Microsoft Excel is a robust, all-around tool that you can use for recording, analyzing, and storing numerical data. Whether you want to carry out data entry or scrape a website’s data, you can do it in Excel without having to switch to a different app. What’s more? Excel has advanced charting and plotting features with plenty of options to customize so that you can create sophisticated and personalized graphs and charts.
Power BI vs Excel
Before you consider signing up for Power BI training, it’s crucial to understand how Power BI is different from Excel. Choosing between the two can put you in a dilemma, but you can make it easier by asking yourself the following questions:
- Is price a factor?
- Do I need high-level analytics?
- How big is the data that I’m handling?
- Do I need to collaborate?
- Do I need effective data visualizations or advanced ones?
Now, let’s see how Power BI and Excel can individually fulfill your needs.
- Power BI is free unless you require advanced functionalities. On the other hand, Excel isn’t free, and you have to purchase Office 365 Suite or Excel alone.
- Power BI provides high-level analytics with added features like KPI, dashboards, alerts, and visualizations. Excel is excellent for constructing your ideal model with the available Excel add-ins and functions.
- Power BI has robust compression algorithms, allowing the analysis of large files. Excel, however, cannot store vast amounts of data.
- Collaboration is hassle-free in Power BI. But, Excel fails in this aspect. So, you should store your file in the cloud.
- Visualizations in Power BI are more appealing, but Excel offers more advanced charts and graphs.
- Besides, the Excel spreadsheet is more user-friendly, unlike Power BI, where table creation is not easy. Moreover, Power BI allows the sourcing of data only from a single dataset.
When it comes to business analytics, choosing between Power BI and Excel is tough. Each has its pros and cons, but what matters is how efficiently you tap their potential. If you are comfortable with the Excel interface, then giving a shot to Power BI may be worth your time. You can always write your data in Power BI and export it to Excel if you feel the need. So, if you want to explore the full benefits of the robust BI platform, get the Power BI training today!
Have you tried using Enterprise BI? This is a great content by the way.